Seawater reverse osmosis (SWRO) is growing worldwide to bridge the gap between increased demand and climate-driven water scarcity. However, compared to other sources such as ground and surface water, fresh water from SWRO is relatively expensive.
SWRO costs vary widely depending on many factors. While many of these costs are determined by the size and location of the plant, it is possible to reduce electricity costs – a very significant cost driver for SWRO – by designing plants that run as energy-efficiently as possible.
Cost is a barrier to wider adaptation of SWRO especially in low- and middle-income countries with growing populations – just those most threatened by water scarcity. According to Relief Web, by 2050 water availability per capita in high- and upper-middle-income countries is projected to drop by 5% and 12%, respectively, but will decrease by 30% in lower-middle-income countries. In low-income countries the situation will be even worse: here, average water availability is projected to fall by 46%.
Of course, SWRO will not be an obvious option for populations that live far from the sea. At least not in low-income countries. But since more and more communities will use SWRO for some or all of their water needs, understanding the cost drivers of SWRO is essential to making economically sound decisions.
Many variations in worldwide SWRO plants and costs depend on plant location and size
SWRO is not a standardized, off-the-shelf solution. A range of variables influence its cost structure regarding both capital expenditures (CAPEX) for procuring the plant and ongoing operational expenditures (OPEX) for maintaining and running the plant throughout its lifetime.
Many SWRO costs vary relative to the location of the plant and the nature of the seawater near that location. Both variables can affect CAPEX and OPEX. While these are not “fixed costs” in accounting terms, and all are subject to negotiation, these costs are largely determined by where in the world the plant will be built and afford little “wriggle room” for optimization. Such costs include:
- Land acquisition costs: The closer the SWRO plant is to the sea, the lower costs for intake (bringing water from the sea to the plant) and outfall (discharging brine back to the sea) structures will be. However, land at some seaside locations might be (much) more expensive to buy than land located further inland.
- Site development costs vary significantly depending on the nature of the site. As we’ll see below, civil engineering expenditures typically represent a significant portion of CAPEX.
- Power transmission costs must be considered in situations where the SWRO plant is located far from power sources and extra costs are necessary to connect to the grid.
- Water transmission costs for SWRO vary depending on the plant’s distance from both the sea and end users.
- The quality of the raw water: Salinity, total dissolved solids, organic loading, and the potential for algal blooms all determine a plant’s pre-treatment and high-pressure requirements, thus influencing CAPEX as well as OPEX.
- Intakes and outfalls also play a significant role for SWRO costs. Depending on the location, it might be necessary to lengthen the intake structure to reach cleaner water than what is available near the shore. Similarly, more complex discharge systems will be necessary in environments where it is imperative to protect sensitive marine habitats from the effects of increased salinity.
- Environmental regulations: Different countries and even different states and regions within countries regulate SWRO plants in their own ways. SWRO plants in Australia and the U.S., for example, have stricter environmental regulations than many countries in the Middle East and North Africa – and thus higher costs for environmental impact studies and permitting. Within the United States, California’s environmental regulations result in higher costs than Florida’s.
- Energy costs vary in the extreme around the world. According to the International Energy Agency, industrial rates in 2021 average about USD 100/MWh, with the highest rates outpacing the lowest rates by a factor of 10. This price disparity also includes countries where SWRO is an important source of fresh water, such as Cyprus (USD 238.8/MWh) and Algeria (USD 21.6/MWh).
In addition to the variables above, some cost drivers depend more on design choices than location. These include:
- Scale: The volume of produced water and the plant capacity needed to do so impact cost. Generally speaking, economies of scale mean that the larger the SWRO plant, the lower the cost of produced water per m3.
- Energy efficiency: As energy represents at least 45% of OPEX, choices about the energy efficiency of key components matter. As we’ll see below, including isobaric energy recovery devices (ERDs) in plant design is the most significant way to increase energy efficiency, but selecting the most energy-efficient high-pressure pumps is also important.
The elements of SWRO CAPEX
As demonstrated in the chart below, total CAPEX costs comprise a wide range of components.
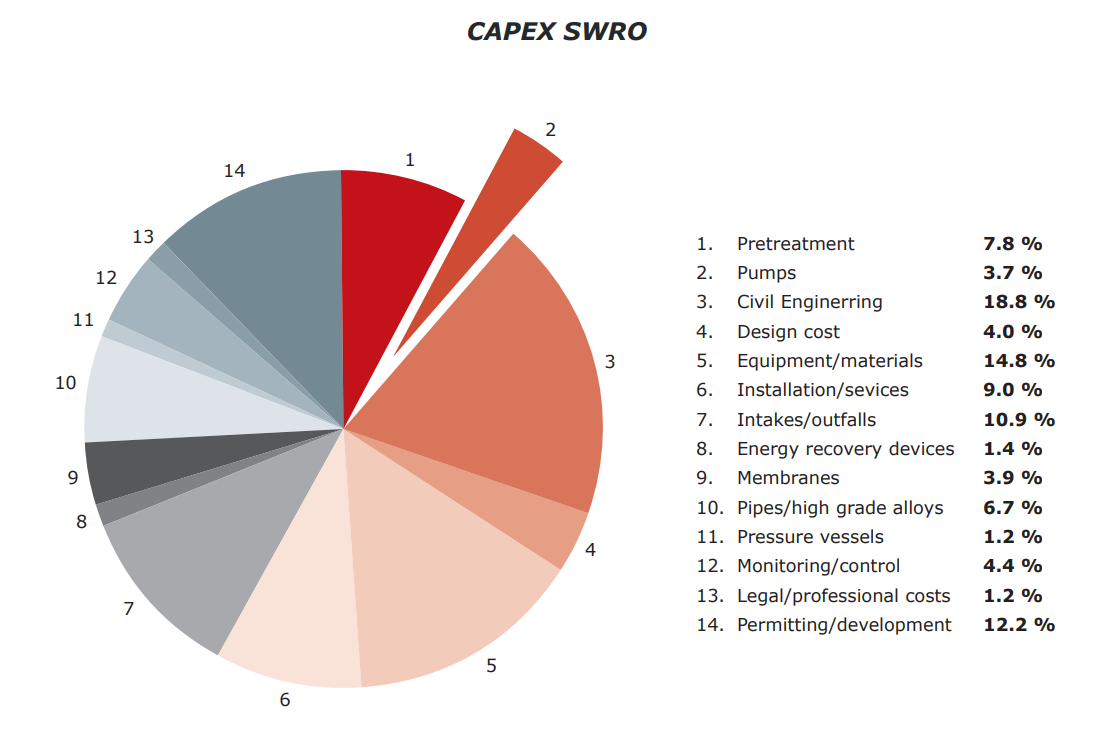
Civil engineering (19%) and equipment/materials (15%) represent the largest shares of CAPEX followed by intakes/outfalls (11%) and permitting and development (11%).
As noted, while there is some potential to optimize CAPEX costs, the size and the location of the plant will significantly limit the range of such optimizations. As we’ll discuss below, however, there are two CAPEX decisions that can have significant consequences for a plant’s OPEX and total lifetime costs.
- ERDs, which make up less than 2% of average total CAPEX, have a dramatic effect on energy consumption and OPEX.
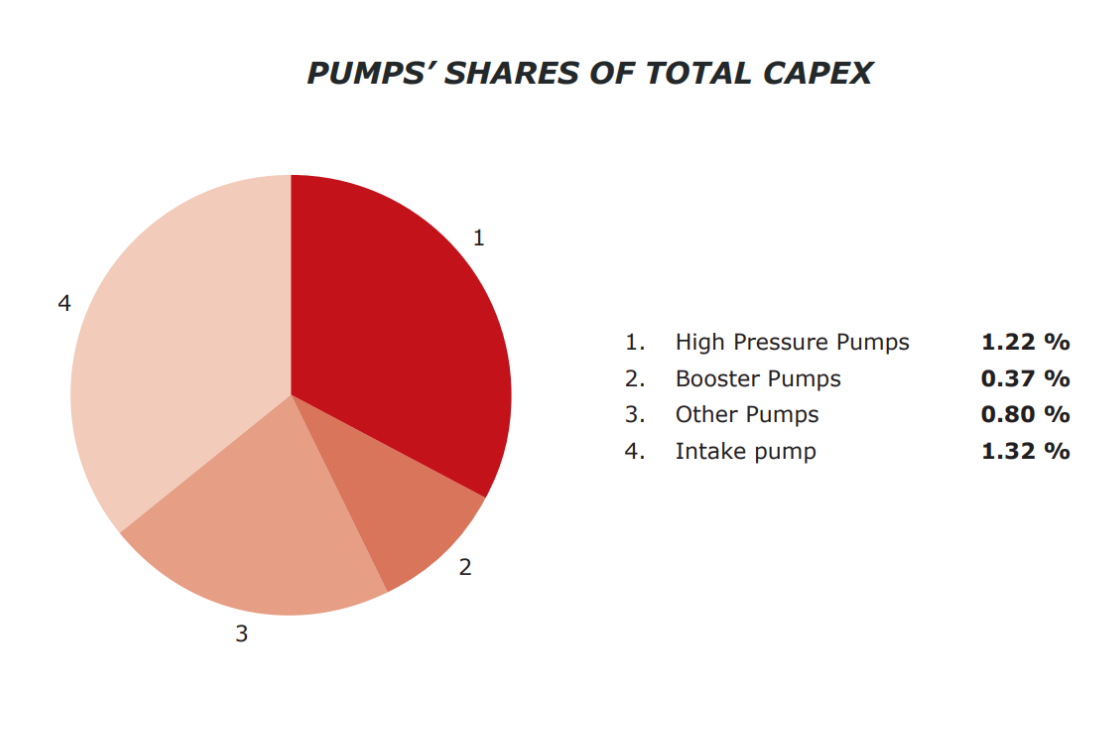
- Similarly, selecting the most energy-efficient high-pressure pumps, which account for only 1.22% of average total CAPEX, can also significantly reduce energy consumption and OPEX compared to less energy-efficient alternatives.
The elements of SWRO OPEX
OPEX comprises a range of cost categories. Although all of these depend on actual plant output and running hours over time, some are more “variable” than others.
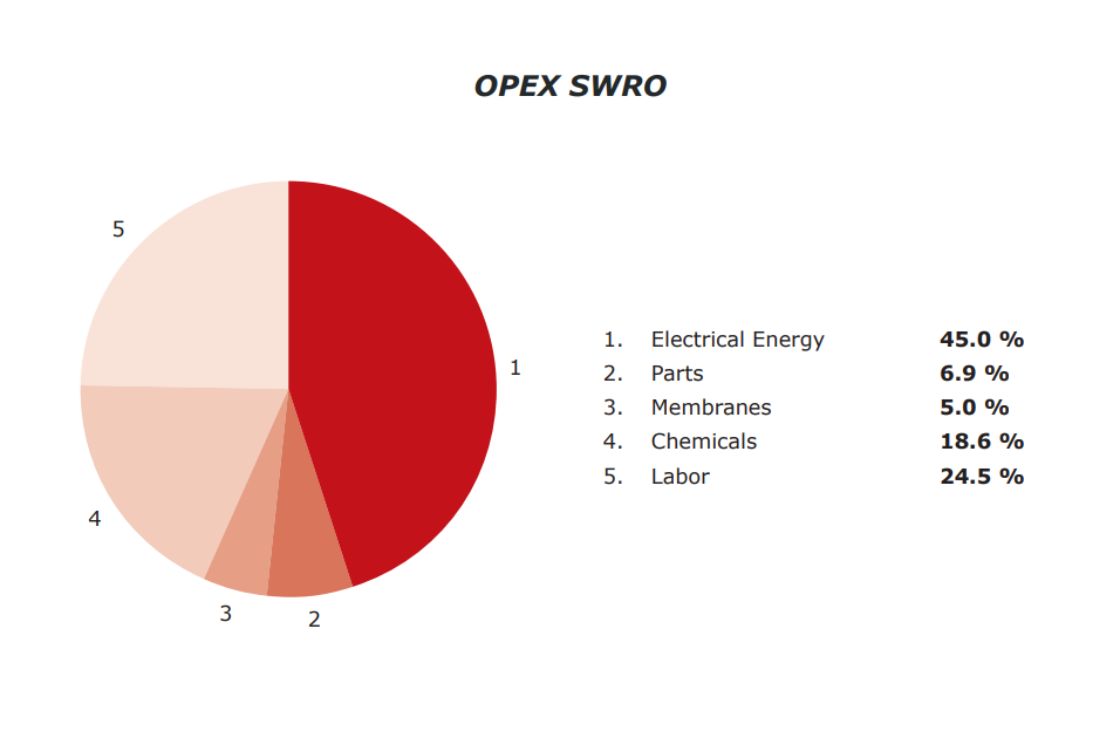
Along with chemicals, replenishments such as spare parts and membranes can be presumed to cost roughly the same no matter where in the world the plant is located. Labor costs, on the other hand, will differ depending on whether the plant is located in a high-, middle- or low-income country.
This leaves energy, by far the largest OPEX cost driver. While out of pocket energy costs vary widely by country, we estimate that electrical energy costs make up at least 45% of total operating costs on average.
Unlike most OPEX and CAPEX elements there is significant “wriggle room” within energy consumption to reduce overall costs significantly. The keys to these OPEX savings lie in CAPEX decisions concerning ERDs and high-pressure pumps:
- For a relatively small upfront investment in terms of total CAPEX, SWRO plant operators typically save up to 60% of total energy costs by including isobaric ERDs in their designs. Although ERDs have become increasingly common over the last 15 years, there are still many SWRO plants that operate without them.
- Similarly, because high-pressure pumps responsible for SWRO’s osmotic exchange represent 80% of all electrical energy costs, or over a third of total OPEX, opting for the most energy-efficient high-pressure pumps available can also make a big difference in the long run. In many cases, and whenever feasible, axial piston pumps reduce overall energy costs by 20-30% compared to centrifugal pumps, making short work of payback time on the incrementally higher initial CAPEX cost.
Looking beyond CAPEX and OPEX to total cost of ownership
As illogical as it might seem, not all SWRO plants are optimized to save costs where they can. This is especially true for energy costs.
In some cases, this is because plants were built before the time when isobaric ERDs and high-efficiency high-pressure pumps were as readily available as they are now. The business case for retrofitting such older plants to make them more energy-efficient is often compelling but must be decided on the basis of individual cost-benefit and payback time analyses. Read our blog to see just how much energy and CO2 emissions the world could save if all SWRO plants were retrofitted to be as efficient as is currently possible.
In other cases, a narrow focus on CAPEX to the exclusion of OPEX results in procurement decisions that favor the lowest price today without considering operational costs tomorrow and for the rest of the plant’s lifetime.
The only real solution to such suboptimization is the application of total cost of ownership principles. But that’s the subject of another blog.
Related blogs


Read more about our solutions for desalination
-
if (isSmallPicture) {

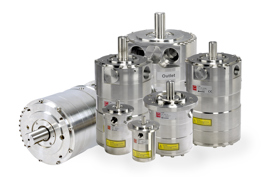
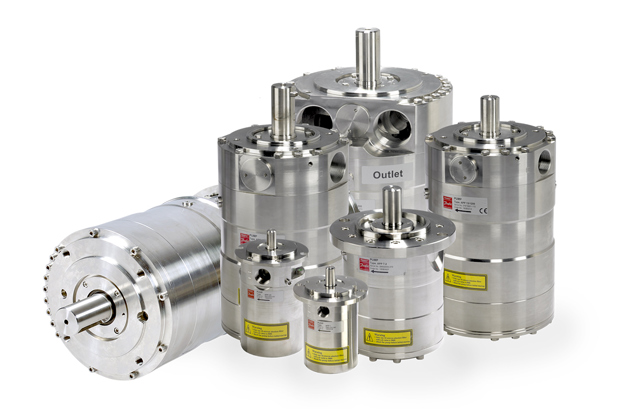
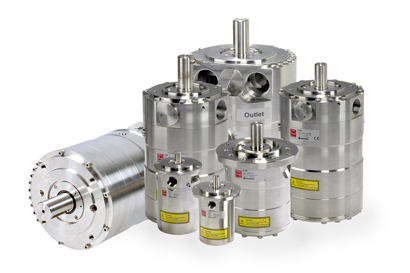
The range of high-pressure APP pumps is optimized for both landbased, off-shore and marine sea water reverse osmosis applications. Available with or without motor.
-
if (isSmallPicture) {
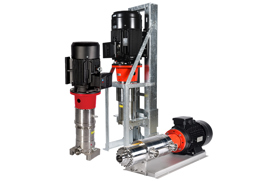
The first active ERD for medium and large plants integrates highly effective isobaric pressure exchangers with a low-voltage motor to eliminate the risk of rotor overspin, reduce mixing and biofouling, and facilitate smarter automation. Covering train sizes from 1,500 m3/day and above.
-
if (isSmallPicture) {
With a 3-in-1 design that integrates highly effective isobaric pressure exchangers with positive displacement booster pumps and electrical motors, iSave® ERDs deliver big energy savings in small spaces. Covering train sizes from 200-3,000 m3/day


-
if (isSmallPicture) {
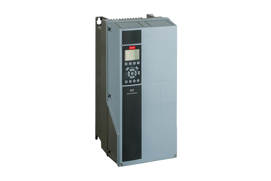
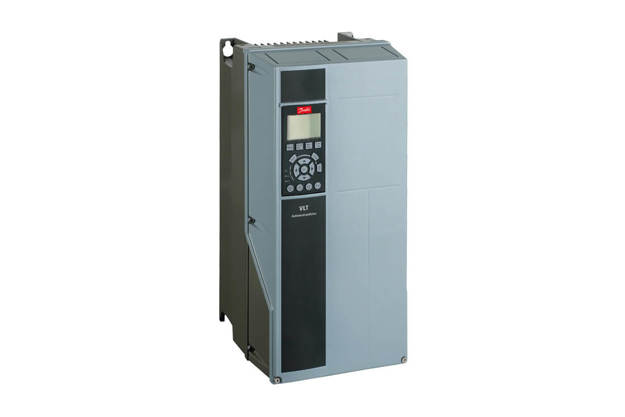
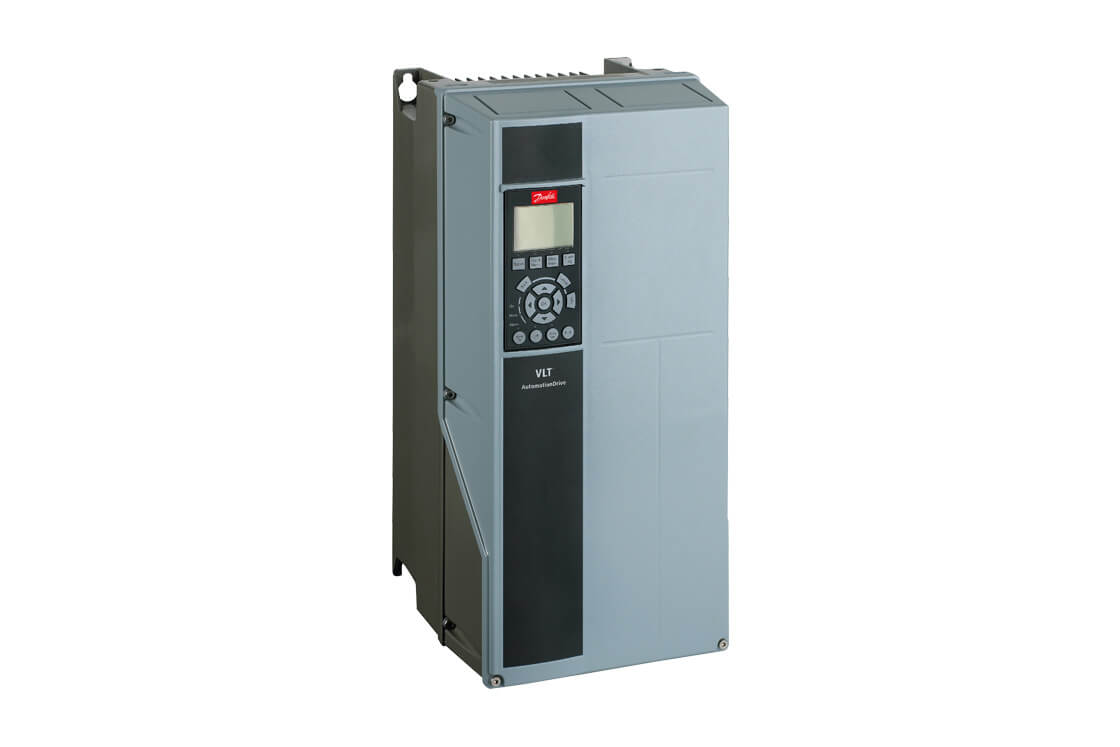
VLT® AQUA Drive FC 202 controls all types of pumps and comes equipped with a cascade controller.
-
if (isSmallPicture) {
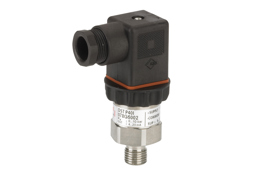
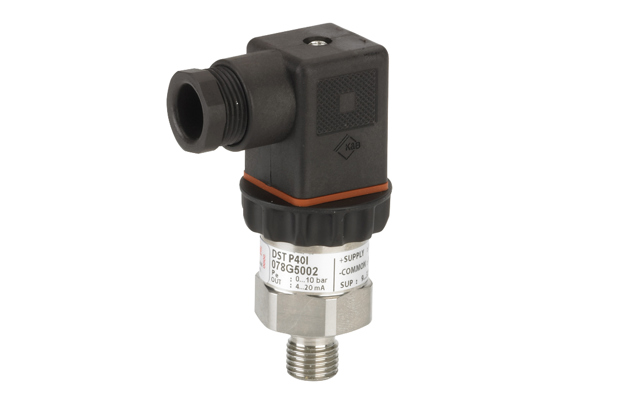
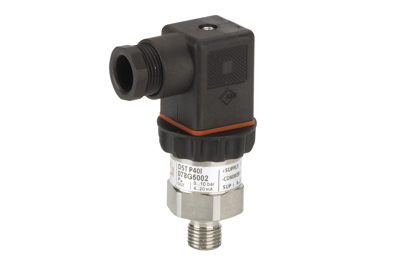
For use in corrosive environments and with aggressive media, Danfoss offers the robust DST P40I pressure transmitter made of Titanium and with ceramic pressure sensing element. DST P40I is optimized for use in applications such as desalination systems, seawater cooling, and chemical processing.
Explore our case stories


Read our latest news to stay up-to-date with latest developments of our products and solutions.
Subscribe to our eNewsletter and receive news and articles in your email inbox.