The water-energy nexus
It takes a lot of water to produce energy, and it takes a lot of energy to produce potable water.
Worldwide, we use an estimated 52 billion cubic liters of fresh water annually not for irrigation, drinking, or washing – but to produce energy and generate electricity. Some of this electricity is used, in turn, to produce fresh water: the International Energy Association estimates that globally, the water sector currently needs about 1,000 TWh of electricity per year on the water-use cycle, from water supply and conveyance to water and wastewater treatment. Even more electricity will be required in the future.
While scientists and policymakers have traditionally dealt with water and energy systems independently, climate change and water scarcity are driving a growing consensus that water and energy infrastructures are, in fact, very connected. Droughts slow down power plants that rely on huge volumes of water for cooling. Hurricanes knock out the electrical supply that enables the production and distribution of fresh water. Cold snaps freeze water lines as well as natural gas wells and wind turbines.
The “water-energy nexus” is a broad term that encourages policymakers to understand and consider the relationship between energy and water systems and their many interrelated tradeoffs. In a future that will almost certainly be characterized by more water shortages, a growing number of extreme weather events, and greater decarbonization efforts, it will be increasingly important to consider the interdependencies of the water-energy nexus.
Energy inputs are required at every stage of the water use cycle, but the actual energy intensity of water use varies significantly
All modern water and wastewater services rely on electricity every step of the water use cycle illustrated below, but just how much electricity is required varies significantly. The World Bank estimates that electricity represents anywhere from 5-30% of total water and wastewater operating costs globally, and in some instances, as much as 40%.
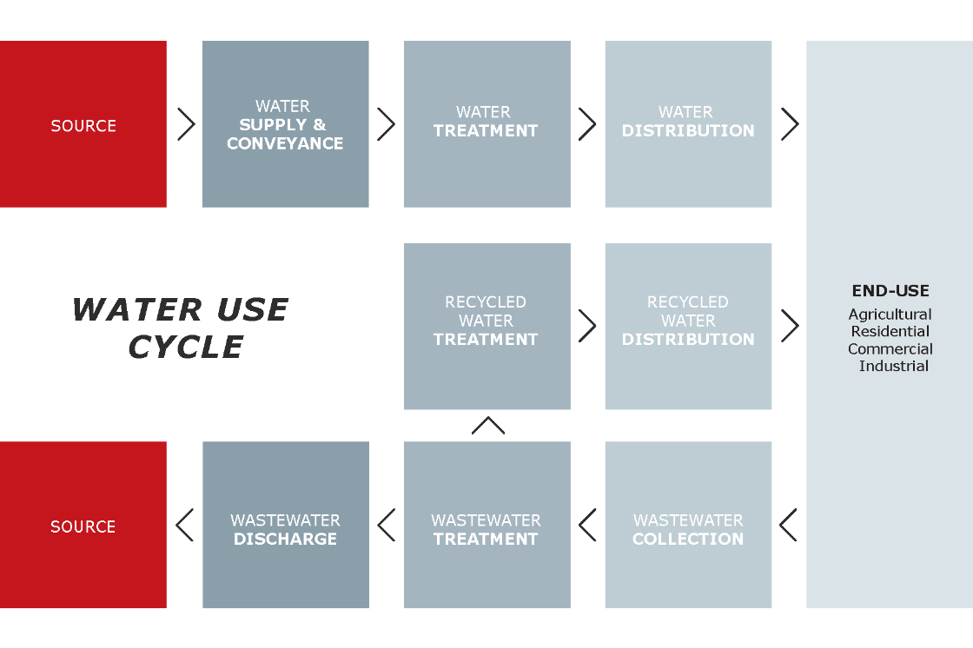
Illustration based on Klein et al., page 7
We’re primarily concerned with the first stages of the water use cycle for this blog, where we want to understand the relative energy intensity of potable water derived from surface, groundwater, brackish groundwater, recycled water, and desalinated seawater. This concerns water supply, conveyance, and treatment.
Just as electricity’s share of overall operating costs varies significantly, so does the energy intensity of all water use cycle segments. As can be seen in the table below, the range of energy requirements for water supply, conveyance and treatment is large – up to a factor of 14,000 – depending on where your water comes from and how it is treated.
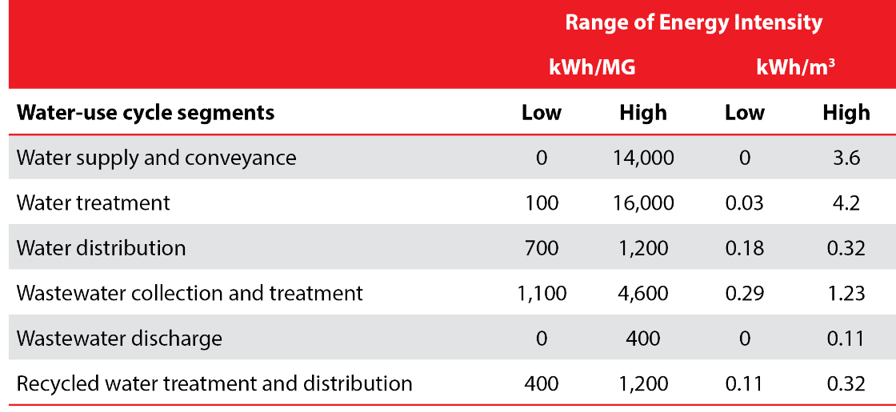
Table based on Klein et al., p. 9
To get a sense of what underlies such variations, consider two major cities in the United States that both rely primarily on surface water. The city of Chicago, located on the shore of Lake Michigan, doesn’t need to spend much energy to pump water from the lake. Nor does the relatively clean lake water require much treatment before it is sent to users. Compare this to San Diego, which imports most of its water from Northern California and the Colorado River – some of which must be pumped nearly 2,000 feet, or 600 meters, over a mountain range on its way to Southern California. But as drought is common in the water-scarce region, San Diego also relies on seawater reverse osmosis (SWRO) for about 10% of its water, a share that is likely to increase in the future.
The energy intensity of a glass of tap water in San Diego will be much higher than it is in Chicago. Precisely how much more energy-intensive Southern Californian water is compared to Midwestern would depend on whether your particular glass came from desalinated or transferred water.
Does this mean that people in San Diego are less climate-conscious than those in Chicago? Of course not. Where water transfer and desalination are the only available options for growing populations, people with a choice will pay for the incremental financial and environmental costs rather than migrate elsewhere.
The generic energy intensity of five types of water supply…
Given such variations, determining the energy intensity and carbon footprint of the different types of water supply requires making some assumptions. As seen in the example above, “surface water” can be more or less energy-intensive depending on how far and high it must be conveyed before treatment. For this and other supply types, reliable calculations can only be made by gathering energy input data from a range of water plants over time.
This is exactly what scientists have done to come up with the comparison presented in the table below. The table is based on work by the Pacific Institute, which developed the “Water-Energy Simulator” to evaluate energy use in water management using energy use data from 125 water utilities across the United States.
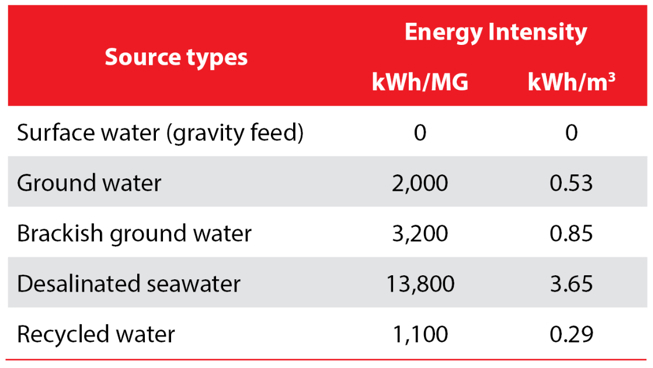
From Griffiths-Sattenspiel and Wilson
The table above compares generic estimates of different water sources’ energy intensity and reveals significant variation by source type. The most energy-intensive type, desalinated seawater, is 12 times as energy-intensive as the least energy-intensive type, recycled water.
…and what that means in CO2 emissions
The CO2 emission intensity of one kWh depends on how that electricity is produced. Whereas electricity generated from wind, solar and nuclear is considered to be carbon-neutral, electricity generated from natural gas is estimated to generate 413 g CO2/kWh, and coal 1,002 g CO2/kWh. To get a representative average, we use the latest US data, which estimate that 1 kWh results in 0.92 pounds, or 417 g of CO2.
Similarly, residential water use per capita also varies widely. Americans are estimated to use about 340 liters of potable water per day, roughly twice as much as the average European’s 144 liters per day. Low-income countries use much less potable water per day.
If we pull all of these assumptions based on US data together, we can calculate the energy intensity and carbon footprint of the various water supply types as follows:
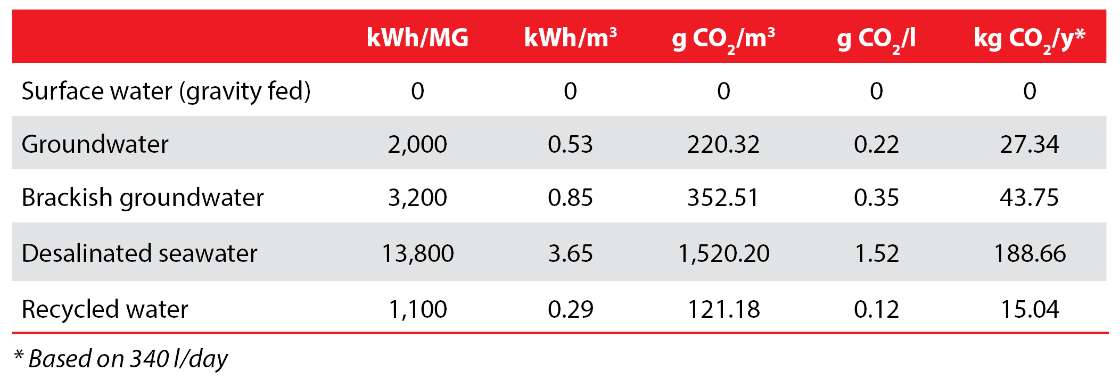
Thus, according to these assumptions, the energy used to produce one liter of desalinated water, the most energy-intensive water source, results in an average of 1.52 grams of CO2, or 1.5 kg CO2 /m3. The estimated carbon footprint of desalinated seawater we arrive at here falls at the low end of the range described by other researchers, who calculated the carbon footprint of SWRO between 0.4 – 6.7 kg CO2/m3.
Less than two grams of CO2 per liter of water isn’t much, but the carbon footprint of one person using only desalinated water adds up to 517 grams per day and about 189 kilos per year. This is about the same as 5.25 kg of beef, which has an estimated carbon footprint of 36 kg CO2eq per kilogram, but still far less than a return flight between London and New York, which results in a per person carbon footprint of 986 kg CO2.
Nonetheless, multiplied by the millions of people who are increasingly dependent on SWRO for their fresh water and the increasing urgency of decarbonization, there are many good reasons to minimize the carbon footprint of desalinated and other water supply types.
Related blogs

As we’ll see, thermal distillation, though still used today, is just the first generation of technologies adapted and developed to desalinate water. In terms of energy intensity, much has happened since Aristotle walked the shores of ancient Greece.

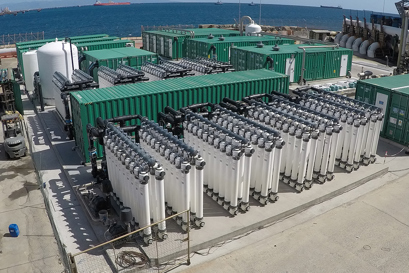
Although just one percent of worldwide water consumption currently derives from desalinated seawater, desalination is responsible for an outsized share of water treatment’s global energy usage.

Worldwide, seawater reverse osmosis (SWRO) capacity is growing and will continue to expand in the foreseeable future.
Read more about our solutions for desalination
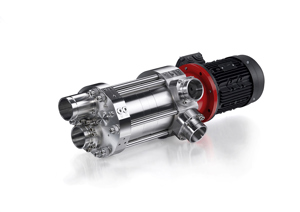
The first active ERD for medium and large plants, the MPE 70 integrates highly effective isobaric pressure exchangers with a low-voltage motor to eliminate the risk of rotor overspin, reduce mixing and biofouling, and facilitate smarter automation. Covering train sizes from 1,500 m3/day and above.
With a 3-in-1 design that integrates highly effective isobaric pressure exchangers with positive displacement booster pumps and electrical motors, active iSave® ERDs deliver big energy savings in small spaces. Covering train sizes from 200-3,000 m3/day
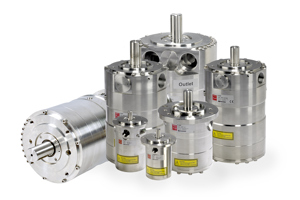
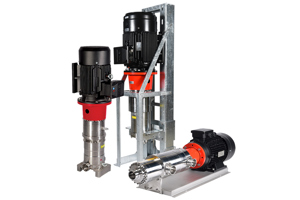
The range of high-pressure APP pumps is optimized for both landbased, off-shore and marine sea water reverse osmosis applications. Available with or without motor.
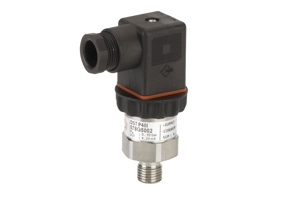
For use in corrosive environments and with aggressive media, Danfoss offers the robust DST P40I pressure transmitter made of Titanium and with ceramic pressure sensing element. DST P40I is optimized for use in applications such as desalination systems, seawater cooling, and chemical processing.
VLT® AQUA Drive FC 202 controls all types of pumps and comes equipped with a cascade controller.
Explore our case stories
A reduction of 57% on the energy consumption was achieved by retrofitting with Danfoss pump and iSave ERD.

38% reduction in the energy costs and an outstanding reduction of carbon emissions are benefits perceived by an Hawaiian golf course community using Danfoss APP pumps in their irrigation system.
Danfoss solutions enabled the creation of an innovative sea water reverse osmosis (SWRO) modular desalination plant for the Sarlux refinery in Sardinia.
Follow us to stay up with the latest high news, updates, announcements, and resources from High Pressure Pumps. Of course, we want to hear from you too - so jump in and join the conversation.