
Plan, visualize and optimize district energy systems for a sustainable network operation
Leanheat® Network is a thermo-hydraulic
modeling tool, developed specifically or
use in district energy systems to support
the planning, design, and operational
processes. Leanheat® Network, the planning
process for the district heating utilities will
invariably result in a decrease of the cost for CapEx and OpEx.
Navigate growth and regulation with smarter planning tools for district energy
Lower CapEx and OpEx through smarter planning
Achieve energy and cost savings
Ensure stable, efficient, and optimed distribution
Design and operate your district energy distribution system optimally with Leanheat® Network

- Efectively build and maintain district heating and cooling network models
- Simulate hydraulic and thermal conditions in district heating and cooling networks
- Optimize network supply temperatures and pressure conditions according to the actual demand needs. Lower your network losses, as well as production & pumping costs
- Predict and understand future consumption on your network based on state-of-the-art AI, taking into account historical data and weather forecast
- Plan optimal techno-economical production mix, optimizing production costs and increasing income from CHPs while still ensuring the quality of supply
Leanheat® Network brochure
Would you like to learn more about Leanheat® Network? Check out the brochure!
How it works
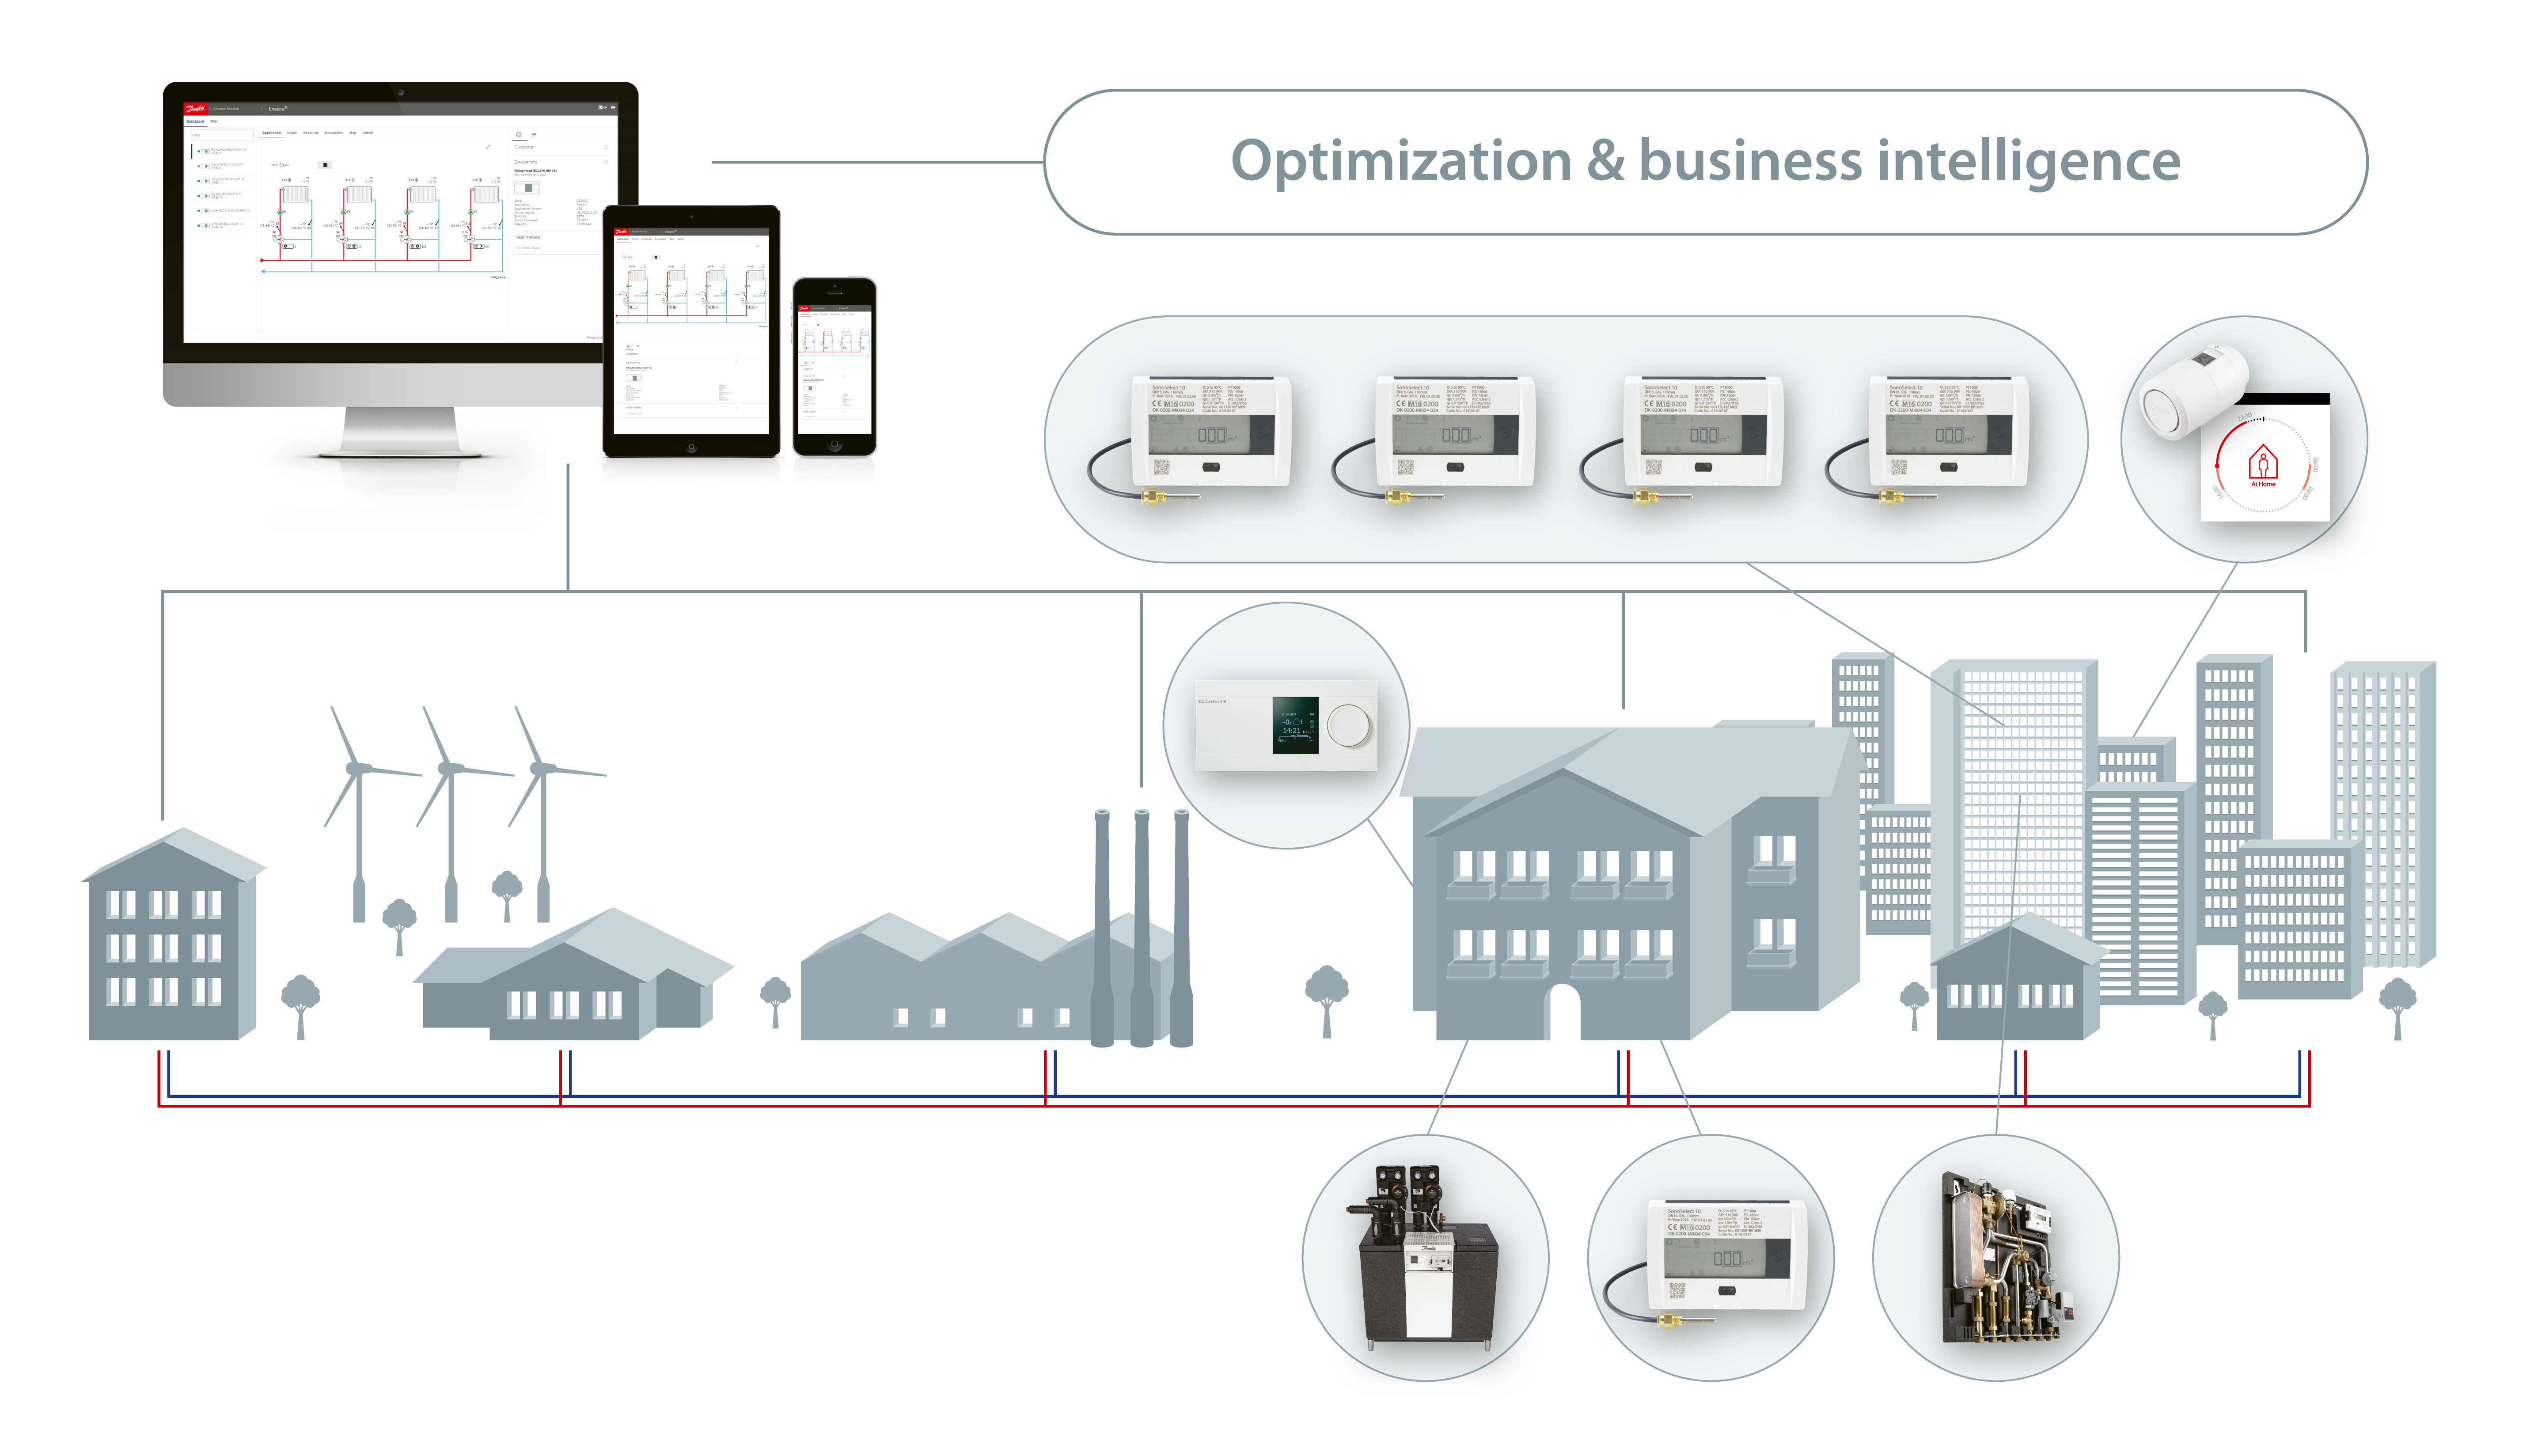
Leanheat® Monitor enables you to connect all different parts of your district energy system, such as heat meters, substations, production units, network measurements, etc. and also third-party sources (e.g. weather forecast) into one secure system.
This data can then be used for optimization of your system using Danfoss optimization solutions like Leanheat® Network & Leanheat® Building (in a plug & play manner) or any third-party optimization solution using standard API interface.
Videos

Demo video
Watch Leanheat® Monitor demo video and get familiar with the tool. See the main functionalities and features, such as maps, graphs and alarming, being put to use.
Case studies
Coming soon...
Coming soon...